

Chinese democracy and the postcommunist blues
How the public and experts rate democracy

 | mikeladano.com")
In an earlier post, I compared the opinions of American citizens and political scientists on the state of democracy in the US. One of the surprising conclusions was that throughout Trump’s term, political scientists tended to give our democracy higher scores than citizens, higher scores even than Trump supporters. I speculated that this might be due to political scientists’ focus on enduring institutions rather than day-to-day behavior.
I was curious how these assessments carried over to the rest of the world. Are political scientists in general more sanguine about the state of democracy than citizens? Or are they sometimes more pessimistic and can we say where and when their assessments differ?
Based on the data I analyze below, I came to three conclusions:
For a significant group of countries, particularly the more successful postcommunist states and a few other new democracies, political scientists evaluated democracy more positively than citizens.
However, there was also a group of countries – mostly those with strict media censorship and state propaganda machines – where the public saw their own countries as very democratic but political scientists were of the opposite opinion.
Maybe most surprising was that overall there was little correlation between the assessments of publics and experts both at a single moment and over time.
Where does this leave us? One implication might be that political scientists are missing something – certain flaws in new democracies and responsiveness to citizens in certain authoritarian states. See, for example:

I wouldn’t ignore this possibility, but expert assessments have gotten better in recent years, especially with the inauguration of the Varieties of Democracy measure that I use below. Maybe better would be to say that publics and experts have different conceptions of democracy.
A more fruitful implication is that citizens’ conceptions of democracy depend more than one would like on history and state policies. This is encouraging in one sense. A change in policies like a freer media might produce more accurate assessments in countries where citizens overrate their democracy.
Places where citizens are more pessimistic than experts, however, raise a dilemma. Should we encourage them to don rosier-colored glasses? Or do their more negative views lead them to tougher judgments of their leaders and in turn better politics?
I incline to the first view. I chide my Czech friends who see their politicians as irretrievably venal. I argue instead that most of their political problems are normal parts of democracy. I tell them this not just because I believe it is true, but because there is a tendency in postcommunist states to throw the bums out at every election. This tendency has some poor incentive qualities that I have written about elsewhere. In particular, it encourages politicians to get while the getting is good because they won’t be returned to office.
No matter the right answer, it is still worth probing the divergences between how citizens and experts rate democracy, which is what I do below.
Method
To do this, I’ll turn to some data. To get a sense of how publics and experts see democracy, I compared a survey question from the World Values Survey (WVS) – the largest cross-national survey of citizens – with what is regarded as our best expert measure of democracy, the Varieties of Democracy (V-Dem), which is based on a survey of country experts.
In particular, I compared country means for the WVS question “How democratically is this country being governed today” (respondents could choose values from 0 – not democratic at all – to 10 – completely democratic) with the Varieties of Democracy (V-Dem) measure of a country’s level of polyarchy (scaled from 0 to 1), where polyarchy is defined as “the core value of making rulers responsive to citizens, achieved through electoral competition for the electorate’s approval.”1
These measures, of course, don’t measure exactly the same thing. In the analysis of Trump I mentioned earlier, I was able to compare equivalent surveys administered to the public and political scientists (thanks to Bright Line Watch). But the two separate measures here at least allow me to see large divergences even if the scales and criteria differ.
Results
The figures below show these relationships for 3 waves of the WVS and roughly contemporaneous scores from Varieties of Democracy. In general, the correlation is not very large (r=0.22 for the late 2010s, r=0.35 for the early 2010s, and r=0.24 for the late 2000s). I include lines for the medians of both measures which divides the figures into quadrants.
(Sidenote: It is probably worth noting that very low public ratings of democracy are relatively uncommon. The median ratings are just above six on a scale of 0 to 10 and are almost always above four. As in the Bright Lines comparisons, experts are more inclined to use the whole scale, while publics tend to concentrate their scores in the center.)
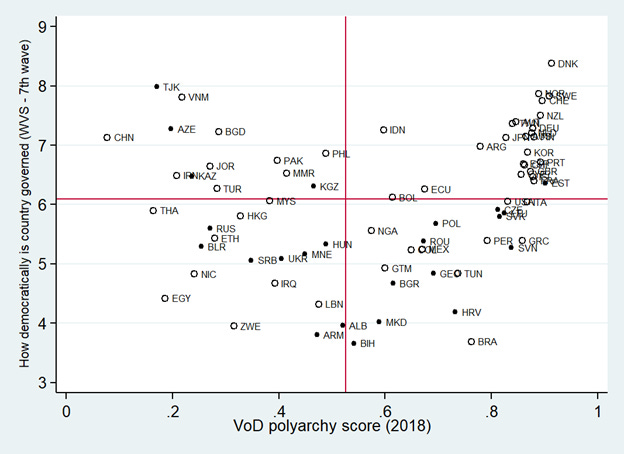


The interesting quadrants are the ones where the public and experts diverge. There are two kinds of outliers:
Experts view the country as relatively democratic, but citizens do not (lower right)
Most of these cases appear to be postcommunist states which are indicated by dark circles. According to experts, their level of democracy is reasonable or even quite good, but citizens tend to believe that they are not governed very democratically. For the most recent data, we see ten countries from the region in this quadrant along with three others just on the border. These include Bosnia, Bulgaria, Croatia, Czechia, Georgia, Lithuania, Macedonia, Poland, Slovakia, and Slovenia (with Albania, Armenia, and Hungary as edge cases). Others in this category include a handful of Latin American countries like Brazil, Colombia, Guatemala, Mexico, and Peru along with Greece, Nigeria, and Tunisia. The earlier surveys mostly confirm that the same kinds of countries fall into this category – postcommunist states along with some Latin American cases and Tunisia.
This quadrant might follow the same dynamic as I hypothesized for Trump in the US. Institutions are basically democratic, but politicians behave badly – they are corrupt or lie or are incompetent. Experts may put more weight on institutions and the public on behavior. The US comes close to this quadrant as well and suggests another explanation – high political polarization may lead to divergent assessments of democracy depending on the party in power.
Virtually all of the countries in this class are relatively new democracies. I would speculate that their citizens brought high and potentially unrealistic expectations to the democratic transition which were then disappointed. They assumed that democracy would solve all their problems, but it inevitably did not and in fact created or brought to light others. By contrast, citizens of established democracies are accustomed to democracy’s flaws and thus more likely to accept them as a normal part of democratic rule.
I might add a cultural element as well. Eastern Europeans tend to be cynical about politics, perhaps due to the communist experience. Pop-Eleches and Tucker (2017) find that citizens raised under communism are less supportive of democracy than their domestic and international peers. This might lead them to more negative evaluations. Their tendency towards negative judgments may also be seen in their low rates of personal happiness.
Citizens view the country as relatively democratic, but experts do not (upper left)
The explanation for this divergence seems relatively clear with China perhaps the typical case. These are mostly countries that keep a very tight lid on the media and further produce copious propaganda in favor of the regime. Others that show up here are Azerbaijan, Bangladesh, Iran, Jordan, Kazakhstan, Malaysia, Myanmar, Pakistan, Rwanda, Singapore, Tajikistan, Turkey, and Vietnam. One might expect Russia to fall in this category, but Russians do have more access to the outside world through the internet and seem to share some of the postcommunist pessimism noted above.
The surprising cases here (for me at least) were Jordan, Malaysia, and Singapore that are more open to the outside world. Perhaps general good governance is substituting for democracy in citizens’ assessments as it might be in China as well (as I discuss below, Ariely shows that good governance helps predict citizens’ assessments of democracy). Nationalism is another potential causal factor – more nationalist publics may view their countries as more democratic – though as China demonstrates nationalism may have its roots in state media.
Citizens and experts agree (upper right and lower left)
The quadrants where experts and the public align require less explanation. The upper right quadrant of positive views from both experts and the public features mainly established democracies. A few Latin American countries appear here at certain times – Argentina, Chile, Colombia, Mexico, Uruguay – as well as South Africa and maybe most surprisingly Ghana whose citizens at one point saw their country as more democratically governed than just about any other.
The lower left quadrant where both the public and experts saw low levels of democracy includes some of the usual suspects like Belarus, Ethiopia, Iraq, Morocco, Russia, and Zimbabwe. As I mentioned above, I would speculate that citizens of these countries are subject to less propaganda and/or have more access to outside information. Or their government’s democratic performance is so poor that it can’t be ignored.
It is noteworthy that countries that received low ratings from experts had more diverse rankings from the public than countries rated highly by experts. This follows the Tolstoyan generalization that unhappy families are more diverse than happy families. (Another explanation could be difficulties with surveying in less democratic countries; in some places, respondents may not give honest answers for fear of persecution. Further, there were fewer surveys conducted in countries with low democracy scores.)
Changes
Another take would consider changes in countries over time. Are public opinion and expert judgments moving closer together or are they diverging? The three waves of the WVS over a decade or so provide a slight bit of leverage on this question. I’d note that this leaves out all cases which were only surveyed in one of the three waves, which includes most countries.
The figure below shows the relationship between changes in V-Dem scores and changes in WVS ratings of democracy. There is essentially no correlation (r=-0.014). Most of the countries with substantial changes in expert ratings line up along the y-axis. The two biggest democratic backsliders according to experts showed more positive views of democracy in the case of Hungary and less positive in the case of Thailand.

Meanwhile there is a fair bit of change in public ratings of democracy, but they mostly line up along the x-axis. That is to say, public views changed while expert views remained stable. Overall, there is little evidence that public views respond to changes noticed by experts (or vice versa).
Caveats and Extensions
I have mainly analyzed divergence as if political scientists have produced accurate and objective measures. It is possible that this is not the case. For critiques, I earlier mentioned this Paul Poast thread:
I would note, however, that V-Dem is considered the gold standard of measures of democracy and improves on some of the flaws of the Freedom House and Polity measures critiqued by Poast.
V-Dem includes other measures besides polyarchy, though those seemed less comparable to the question of how democratically the country is ruled.
Liberal democracy considers whether “states promote individual and minority rights against the tyranny of the state and the tyranny of the majority.”
Participatory democracy emphasizes “the active participation by citizens in all political processes.”
Deliberative democracy considers the extent to which “public reasoning focused on the common good motivates political decisions.”
Egalitarian democracy means that “rights and freedoms of individuals are protected equally across all social groups; resources are distributed equally across all social groups; and groups and individuals enjoy equal access to power.”
In general, these other measures were somewhat better correlated with public evaluations as shown below, but not strongly correlated with them. Just based on these raw correlations we might say that the public most closely embraces the deliberative democracy conception which tends to have the strongest correlations across the three waves.
A potential extension would be to consider the evaluations of citizens disaggregated by their conception of democracy. The WVS includes additional questions that ask citizens about the essential characteristics of democracy. These include whether the people choose their leaders in free elections (perhaps closest to polyarchy), whether civil rights protect people’s liberty against oppression (closer to the liberal conception), and whether the state makes people’s incomes equal (closer to the egalitarian conception).
Ariely (2015) does something like this. His focus is less on divergence than on the roots of public assessments of democracy. He finds that expert assessments (he uses the Freedom House score) contribute to public assessments though they only explain about 10% of the variation (similar to our finding of a limited relationship). He does find a significant contribution from the public’s belief that elections are an essential characteristic of democracy, though mainly in the more democratic countries. GDP/capita and government effectiveness also help to predict the public’s perception of democracy.
Another extension would be to consider the predictors of divergences between citizens and experts’ evaluations. The two potential predictors that jump out, in addition to experts’ assessments of democracy, are restrictions on the media and length of democratic experience. Generalizing from the US, polarization might matter as well.
Conclusion
To reiterate, experts and publics evaluate democracy very differently as evidenced by weak correlations between their evaluations. The main outliers appear to be for more successful new democracies – where the public is more skeptical of this success – and authoritarian regimes which put strict limits on the media – where experts are more skeptical of their democraticness.
An open question is whether these divergent evaluations of democracy are significant for politics and what sort of effects they might have. Are undemocratic countries more stable when their population views them as democratic? Even when these views are based on propaganda and media restrictions?
And what should we say to places that are overly pessimistic about their democracy (including perhaps the US). Would more civic optimism help their democracy? Or would it mean simply forgiving bad behavior by politicians? I would plunk for the former as one of the few ways out of our current dilemma, perhaps in the footsteps of Lepore’s This America, which advocates a more generous nationalism.
The index is built up from measures of freedom of association, clean elections, freedom of expression, elected officials, and suffrage